Popular Multiplication Charts
All charts are free — no signup required. Hover any cell to explore.
| × | 1 | 2 | 3 | 4 | 5 |
|---|---|---|---|---|---|
| 1 | 1 | 2 | 3 | 4 | 5 |
| 2 | 2 | 4 | 6 | 8 | 10 |
| 3 | 3 | 6 | 9 | 12 | 15 |
| 4 | 4 | 8 | 12 | 16 | 20 |
| 5 | 5 | 10 | 15 | 20 | 25 |
| × | 1 | 2 | 3 | 4 | 5 | 6 |
|---|---|---|---|---|---|---|
| 1 | 1 | 2 | 3 | 4 | 5 | 6 |
| 2 | 2 | 4 | 6 | 8 | 10 | 12 |
| 3 | 3 | 6 | 9 | 12 | 15 | 18 |
| 4 | 4 | 8 | 12 | 16 | 20 | 24 |
| 5 | 5 | 10 | 15 | 20 | 25 | 30 |
| 6 | 6 | 12 | 18 | 24 | 30 | 36 |
| × | 1 | 2 | 3 | 4 | 5 | 6 | 7 |
|---|---|---|---|---|---|---|---|
| 1 | 1 | 2 | 3 | 4 | 5 | 6 | 7 |
| 2 | 2 | 4 | 6 | 8 | 10 | 12 | 14 |
| 3 | 3 | 6 | 9 | 12 | 15 | 18 | 21 |
| 4 | 4 | 8 | 12 | 16 | 20 | 24 | 28 |
| 5 | 5 | 10 | 15 | 20 | 25 | 30 | 35 |
| 6 | 6 | 12 | 18 | 24 | 30 | 36 | 42 |
| 7 | 7 | 14 | 21 | 28 | 35 | 42 | 49 |
| × | 1 | 2 | 3 | 4 | 5 | 6 | 7 | 8 |
|---|---|---|---|---|---|---|---|---|
| 1 | 1 | 2 | 3 | 4 | 5 | 6 | 7 | 8 |
| 2 | 2 | 4 | 6 | 8 | 10 | 12 | 14 | 16 |
| 3 | 3 | 6 | 9 | 12 | 15 | 18 | 21 | 24 |
| 4 | 4 | 8 | 12 | 16 | 20 | 24 | 28 | 32 |
| 5 | 5 | 10 | 15 | 20 | 25 | 30 | 35 | 40 |
| 6 | 6 | 12 | 18 | 24 | 30 | 36 | 42 | 48 |
| 7 | 7 | 14 | 21 | 28 | 35 | 42 | 49 | 56 |
| 8 | 8 | 16 | 24 | 32 | 40 | 48 | 56 | 64 |
| × | 1 | 2 | 3 | 4 | 5 | 6 | 7 | 8 | 9 |
|---|---|---|---|---|---|---|---|---|---|
| 1 | 1 | 2 | 3 | 4 | 5 | 6 | 7 | 8 | 9 |
| 2 | 2 | 4 | 6 | 8 | 10 | 12 | 14 | 16 | 18 |
| 3 | 3 | 6 | 9 | 12 | 15 | 18 | 21 | 24 | 27 |
| 4 | 4 | 8 | 12 | 16 | 20 | 24 | 28 | 32 | 36 |
| 5 | 5 | 10 | 15 | 20 | 25 | 30 | 35 | 40 | 45 |
| 6 | 6 | 12 | 18 | 24 | 30 | 36 | 42 | 48 | 54 |
| 7 | 7 | 14 | 21 | 28 | 35 | 42 | 49 | 56 | 63 |
| 8 | 8 | 16 | 24 | 32 | 40 | 48 | 56 | 64 | 72 |
| 9 | 9 | 18 | 27 | 36 | 45 | 54 | 63 | 72 | 81 |
| × | 1 | 2 | 3 | 4 | 5 | 6 | 7 | 8 | 9 | 10 |
|---|---|---|---|---|---|---|---|---|---|---|
| 1 | 1 | 2 | 3 | 4 | 5 | 6 | 7 | 8 | 9 | 10 |
| 2 | 2 | 4 | 6 | 8 | 10 | 12 | 14 | 16 | 18 | 20 |
| 3 | 3 | 6 | 9 | 12 | 15 | 18 | 21 | 24 | 27 | 30 |
| 4 | 4 | 8 | 12 | 16 | 20 | 24 | 28 | 32 | 36 | 40 |
| 5 | 5 | 10 | 15 | 20 | 25 | 30 | 35 | 40 | 45 | 50 |
| 6 | 6 | 12 | 18 | 24 | 30 | 36 | 42 | 48 | 54 | 60 |
| 7 | 7 | 14 | 21 | 28 | 35 | 42 | 49 | 56 | 63 | 70 |
| 8 | 8 | 16 | 24 | 32 | 40 | 48 | 56 | 64 | 72 | 80 |
| 9 | 9 | 18 | 27 | 36 | 45 | 54 | 63 | 72 | 81 | 90 |
| 10 | 10 | 20 | 30 | 40 | 50 | 60 | 70 | 80 | 90 | 100 |
Free Printable Multiplication Charts — Full Collection
Every chart on this page is free to download as a PDF. Click the link, open the file, and print. That’s all there is to it.
Charts by Number Range
Different situations call for different ranges. Here’s what’s available:
The perfect starting point for younger kids in Grade 2 or early Grade 3. Covers the most foundational facts and keeps the grid small and manageable.
The most widely used chart in American classrooms. Covers everything tested in Grade 3 and Grade 4 and is the standard reference for most elementary school students.
A step up from the standard 1–12, useful for students who’ve mastered the basics and are ready to push further.
Great for Grade 4 and up. Useful for pre-algebra prep and students working on multi-digit multiplication.
For advanced learners and older students. Also makes a great classroom poster.
What Is a Multiplication Chart?
A multiplication chart is a grid that shows the products of two numbers side by side — usually arranged from 1×1 to 10×10, 12×12, or beyond. It’s one of the most practical learning tools a parent or teacher can have on hand, because it lets kids look up any multiplication fact instantly while they’re still building memory.
According to the Common Core State Standards (CCSS.Math.Content.3.OA.C.7), students are expected to fluently multiply and divide within 100 by the end of Grade 3 — and to know all products of two one-digit numbers from memory. That’s a big ask for an 8-year-old. A well-placed math multiplication chart bridges the gap between “just learning” and “fully memorised,” giving kids a reference tool they can actually use.
Multiplication Chart vs. Multiplication Table — Is There a Difference?
People use these terms interchangeably, and most of the time they mean the same thing. If there’s a technical difference, it’s this: a multiplication table typically lists the facts for a single number in a column or row format (like “the 7 times table”), while a times tables chart is the full grid showing all combinations at once. For practical purposes like printing, downloading, and learning, the terms are identical. You’ll find both on this site, and they serve the same purpose.
Why Multiplication Charts Help Kids Learn
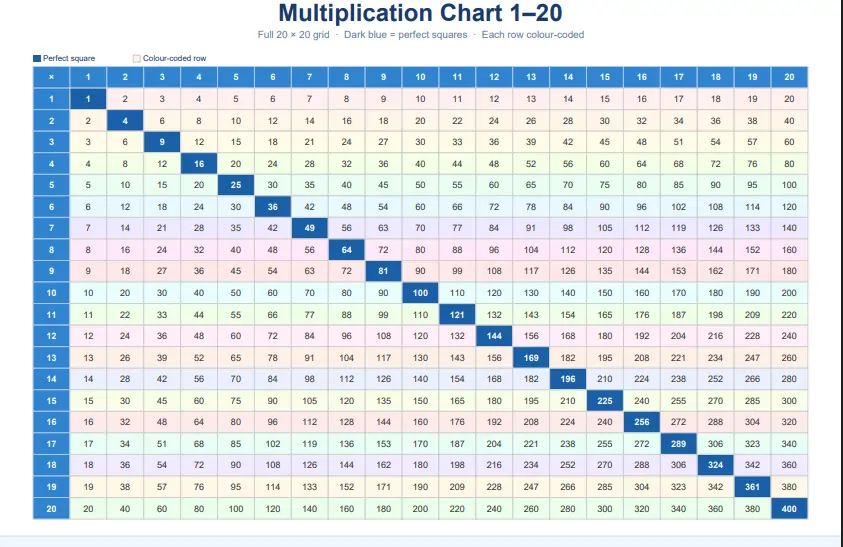
Here’s something most parents don’t realise: a multiplication anchor chart isn’t just for looking up answers. Used correctly, it’s a pattern-spotting tool. Kids who spend time with a filled chart start to see that multiplying by 5 always ends in 0 or 5, that the diagonal from top-left to bottom-right shows perfect squares, and that 6×7 is just one step past 6×6. That kind of visual pattern recognition is what builds real number sense — not just rote memorisation.
💡 TIP: Print a free printable multiplication chart and hang it somewhere your child sees it every day, such as above their desk, on the bathroom door, or on the fridge. Passive exposure to the numbers, even without active studying, helps facts stick faster than you might expect.
Charts by Format
Same ranges, different styles — because every learner is different.
🎨 Colour Multiplication Chart
Bright, visual, and engaging. Colour-coding helps kids spot patterns across rows and columns. Great for visual learners and ideal for wall display or a child’s first introduction to multiplication.
⬛ Black & White Chart
Clean, printer-friendly, and ink-saving. The go-to choice for classroom handouts and quick prints. Works great for student binders, folder inserts, and laminated desk reference cards.
✏️ Blank Multiplication Chart
An empty grid for students to fill in themselves. One of the most effective memorisation practice tools available. Use with a timer for a quick daily challenge.
Colour vs. Black & White — When Each Makes Sense
| Situation | Best Choice |
|---|---|
| Visual learner who responds to colour | Colour chart |
| Printing at home to save ink | Black and white |
| Classroom set for 30 students | Black and white |
| Bedroom wall poster | Colour chart |
| Student binder or folder insert | Black and white |
| Bulletin board display | Colour chart |
| Laminated desk reference card | Black and white |
| First introduction to multiplication | Colour chart |
Colour charts are more engaging for most kids — the visual contrast helps the eye track rows and columns more easily. Black and white charts print cleaner on most home printers and cost less per page. Keep both versions on hand and use each where it fits.
Charts by Size
Large Multiplication Chart
Designed for classroom walls and bulletin boards. Large enough to read from across a room. Print on standard US Letter or Tabloid size and laminate so it survives the full school year. Ideal for Grade 3 and above classrooms where the chart serves as a shared reference during instruction.
Small Multiplication Chart
Mini size for desk reference, student binders, or laminated pocket cards. Print multiple per page to save paper, then cut them out and laminate to business-card or index-card size. Students can write on them with dry-erase markers and wipe clean between uses.
How to Choose the Right Multiplication Chart
Not sure which one to print? Here’s a quick breakdown.
Filled vs. Blank — Which Should You Use?
This depends on where your child is in their learning. A filled math multiplication chart is a reference tool. It’s for kids who are still learning — they use it to check their work, look up facts they haven’t memorised yet, and build familiarity. It relieves frustration and keeps kids moving forward without getting stuck.
A blank multiplication chart is a practice tool. It’s for kids who are close to memorising — they fill in what they know, identify the gaps, and target those specific facts. It’s one of the best low-tech practice methods available, because completing the chart gives kids an immediate, satisfying record of their own progress.
Start with a filled chart. Once your child can recall most facts quickly, switch to the blank version as a daily or weekly check-in.
Which Number Range Is Right?
| Range | Best For | Grade Level |
|---|---|---|
| 1–10 | Beginners, first introduction to times tables | Grade 2 – early Grade 3 |
| 1–12 | Standard classroom use, most tests and homework | Grade 3 – Grade 4 |
| 1–15 | Students who’ve mastered 1–12 and want a challenge | Grade 4 – Grade 5 |
| 1–20 | Pre-algebra prep, multi-digit multiplication | Grade 4 and up |
| 1–100 | Advanced learners, classroom display, pattern study | Grade 5 and up |
📌 When in doubt, print the 1–12. It covers everything your child’s teacher will test and is the standard across most US school curricula.
Multiplication Chart by Grade Level
One of the most common questions parents ask is: Which chart should my child be using right now? Here’s a simple grade-by-grade guide based on the Common Core State Standards.
2nd Grade
Starting With 1–5 or 1–10
In Grade 2, the Common Core focuses on foundational concepts — equal groups, repeated addition, and the very beginning of multiplication thinking. Most 2nd graders are not yet formally learning their times tables, but introducing a 1–10 chart as a visual reference tool is entirely appropriate and can give kids a head start.
At this stage, the goal isn’t memorisation. It’s familiarity. A colourful 1–10 chart on the bedroom wall is a low-pressure way to let numbers become familiar before they’re formally introduced in school.
Recommended: Multiplication Chart 1–10 — colour version, large format for wall display.
3rd Grade
The Standard 1–12 Chart
Grade 3 is when multiplication becomes a primary focus. According to the Common Core State Standards (CCSS.Math.Content.3.OA.C.7), students must fluently multiply and divide within 100 and know all products of two one-digit numbers from memory by the end of 3rd grade.
That’s a major milestone — and a 1–12 chart is the standard support tool for getting there. Most teachers use it as a reference resource during instruction. Many schools allow students to keep one on their desk while they’re still learning.
Recommended: Multiplication Chart 1–12 — filled colour version for daily reference, plus the blank version for weekly practice tests.
4th Grade & Beyond
Moving to 1–20 and Higher
By Grade 4, students are expected to have their basic facts memorised and are moving into multi-digit multiplication, factors, and multiples. A 1–12 chart is still useful as a backup, but ready students can graduate to a 1–20 chart to stretch their thinking.
Grade 4 also introduces work with larger numbers, where a 1–20 or even a 1–100 chart becomes a valuable exploration tool — less for memorisation and more for pattern recognition and number sense.
Recommended: Multiplication Chart 1–20 for active learners; Multiplication Chart 1–100 for classroom display or advanced exploration.
How to Use a Multiplication Chart Effectively
Printing the chart is the easy part. Using it well — in a way that actually builds memory rather than just dependency — takes a little intention.
Step-by-Step — How to Read the Chart
- Find the first number in the leftmost column (running down the left side).
- Find the second number in the top row (running across the top).
- Follow the row from the first number across the grid.
- Follow the column from the second number down the grid.
- The cell where they meet is the answer — the product of the two numbers.
Example: To find 7 × 8: find 7 in the left column, find 8 in the top row, follow both to where they intersect. The answer is 56. Most kids get the hang of it in under two minutes.
Using the Chart to Build Memory — Not Just Look Up Answers
The difference between a chart-dependent kid and a confident multiplier comes down to how the times tables chart is used. There’s a simple rule: look it up, then say it out loud, then cover it and recall it.
When a child looks up 6 × 9 = 54, they should immediately repeat the full equation out loud — “six times nine equals fifty-four” — and then cover the chart and try to recall it again before moving on. This three-step loop (Look, Say, Recall) activates memory encoding rather than just passive reference. Over time, the “look up” step becomes unnecessary. That’s the goal.
💡 TIP: Try the “cover and check” method with a blank multiplication chart. Five minutes of this a day is more effective than 30 minutes of flashcards for most kids.
Fun Activities to Make the Chart Interactive
The times tables chart doesn’t have to feel like homework. A few ways to make it more engaging:
- Skip counting races — start at 0 and count by a chosen number (2s, 5s, 10s) as fast as possible, using the chart's column as a visual guide.
- Pattern colouring — print a black and white chart and have kids colour every multiple of a chosen number. The diagonal patterns that emerge are genuinely interesting.
- Beat the chart — one person calls out a multiplication problem, the other has to answer before their partner can find it on the chart.
- Fill-in challenge — print the blank version and time how long it takes to complete the whole thing. Try to beat the previous time each day.
How to Print Your Multiplication Chart
All charts on this site are available as multiplication chart PDF files, which means they’ll print cleanly on any standard home or office printer.
🖨️ Best Paper Size and Print Settings
- Download the PDF by clicking the download link on the chart page.
- Open the PDF in Adobe Acrobat, your browser's PDF viewer, or any standard PDF reader.
- Select paper size — all charts are designed for standard US Letter (8.5" × 11"). No changes needed.
- Set print scaling to "Fit to Page" or "Actual Size" — either works. Avoid "Shrink Oversized Pages Only" as it can make text smaller than intended.
- Choose print quality — Draft mode works fine for black and white. Use Normal or Best for colour charts, especially if laminating.
- Print and check — hold the page up to confirm numbers are clear and grid lines are visible.
🛡️ How to Laminate for Long-Term Use
A laminated multiplication chart lasts years instead of weeks. Here’s the quickest way to do it:
- Print on standard paper (thicker 24lb bond holds up slightly better).
- Use a home laminator with standard 5-mil pouches — available at any office supply store for under $30.
- Trim any white border before laminating for a cleaner finish.
- For desk reference cards: print the small chart and laminate to business-card or index-card size.
- For wall charts: print the large chart and laminate before mounting.
- A laminated blank chart can be written on with dry-erase markers and wiped clean — a reusable practice tool.
Multiplication Chart Tips for Parents and Homeschoolers
If you’re teaching at home — whether you’re full-time homeschooling or just supporting your child’s school learning — a multiplication chart is one of the most versatile tools in your math toolkit. Here’s how to get the most out of it.
How to Build a Daily Practice Routine Around the Chart
Consistency beats intensity whenever it comes to multiplication facts. A five-minute daily routine is worth far more than an hour of cramming once a week. Here’s a simple structure that works:
☀️ Morning
Hang a filled colour chart somewhere visible — fridge, above the desk, bathroom mirror. No active studying required — just exposure.
📚 During Math Time
Keep the chart available as a reference. Don’t make kids struggle through facts they haven’t learned yet — let them look it up, say it out loud, and keep moving.
🌙 End of Day
5 minutes with the blank chart version. Fill in what you know. Check against the filled version. Circle what to work on tomorrow.
✅ Results: Most kids who follow this routine for 4–6 weeks see dramatic improvement — not because they studied harder, but because the repetition was consistent. If you’re looking for a chart designed specifically for home learning, see our multiplication chart for homeschool page for additional tips and grade-specific recommendations.
Multiplication Chart Tips for Teachers
A classroom multiplication chart serves a different purpose than a home chart. In school, it’s a shared reference tool and a visual anchor for instruction — something students can glance at during independent work without having to ask for help every 30 seconds.
Classroom Display and Desk Reference Ideas
Here’s what works well in actual classroom settings:
🗺️ Wall Chart
Print the large multiplication chart or anchor chart at full size and mount where all students can see from their seats. Laminate it so it survives the school year.
🪑 Desk Reference Cards
Print the small chart at mini size, laminate, and tape one to each student’s desk. Students can use dry-erase markers to circle facts they’re working on.
📐 Math Centre
Keep a set of laminated colour charts at the math centre for small group work and centre rotations throughout the unit.
🏠 Take-Home Copy
Send a black and white chart home with students at the start of the multiplication unit. Parents appreciate having a reference that matches what’s being taught in class.
💡 Anchor Chart Style: For visual display during direct instruction, the multiplication anchor chart version is designed specifically for teaching moments and whole-class reference. It’s large, bold, and easy to read from the back of the room.
Frequently Asked Questions
Ready to Print? All Charts Are Free!
All multiplication charts on this site are free to print and use for personal, classroom, and homeschool purposes. No signup, no email, no cost.